The Ultimate guide to Journaling with Chartlog
Insights - How to improve your performance
Every day, you journal your trading: You flip through the charts, note down your thoughts, review the trades, check your overall statistics on your dashboard, and track your progress. That process alone will help you tremendously with learning from your past trades and keeping yourself accountable. But there is more!
The Insights section is where the magic happens. First, you’ll see an overview with a graph and a few widgets. Let’s set the timeframe to All time, so we can analyze our entire example set. By default, the graph shows you your total net P/L and the widgets display key metrics such as total fees, number of trades, win rate, profit factor, number of executions, total quantity, average P/L per day, average P/L per trade, largest profit, largest loss, etc. These are fully customizable.
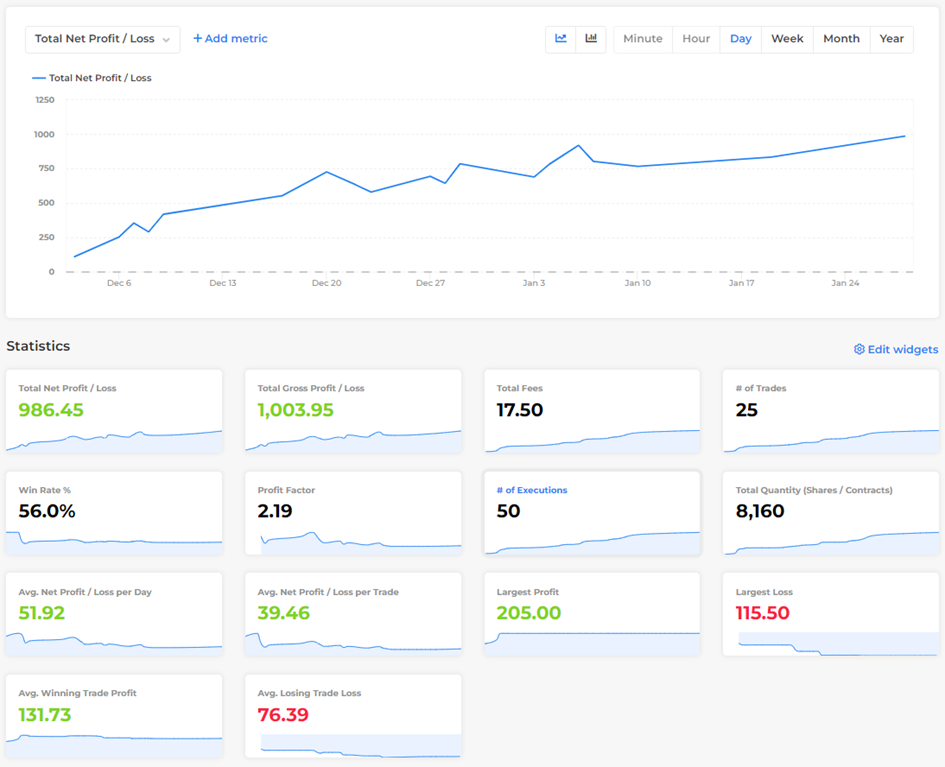
In our sample set, we won 56% of all trades, our profit factor was 2.10 and we only paid 17.5 USD in total fees. Interestingly, our average losing trade lost -76.39 USD and the average winner made 131.73 USD. Accordingly, the risk/reward ratio is 131.73 / 76.39 = 1.72.
Let’s be clear: These are very positive stats, so the first thing we can conclude is that our trading seems to be working pretty well. Now, let’s dive deeper and check out some reports!
Chartlog offers a variety of reports: Strategy, Date & Time, Price & Quantity, Tags, Assets, Custom Fields, Fundamentals, and Technicals. Additionally, you can always create your own custom reports under Analytics.
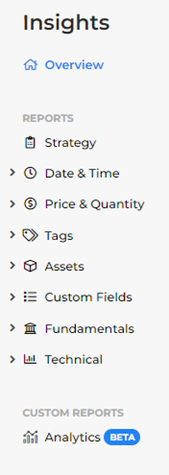
But what are these reports for? The goal of analyzing our trading using statistical reports is to find out what factors determine how well our strategies and our trading in general work.
Which of your setups give you an edge in the market and which ones make you lose money? Are you trading worse on Fridays? Are you trading better in the morning than in the afternoon? What is your sweet spot when it comes to the price of a stock? Do you understand low floats better or worse than large caps? Are you more successful going long than you are going short?
There are so many questions you might have about your own trading… Chartlog’s Insights section will provide you with the answers! Create a trading system that is consistently profitable based on statistical data!
Back to our example set: Let’s say we suspect that the 1minORB works better to the short side than it does to the long side. Also, we believe that it is particularly successful if the 1st 1min candle is an (inverted) hammer. Until now, these are only gut feelings, we need hard data to prove or refute these ideas.
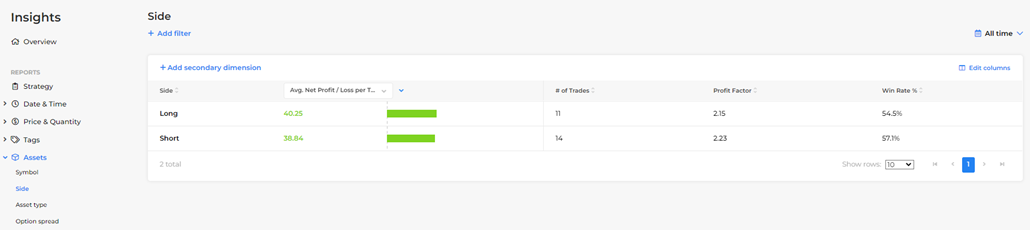
Got to Assets, Side, and choose Avg. Net Profit/Loss per Trade as the metric we want to measure. You’ll see that against our assumption, the direction of the trades did not have a significant impact on the outcome. The average P/L per trade, the profit factor, and the win rate: None of these differs much between long and short trades. Therefore, we should not make a difference between longs and shorts in our future trading.
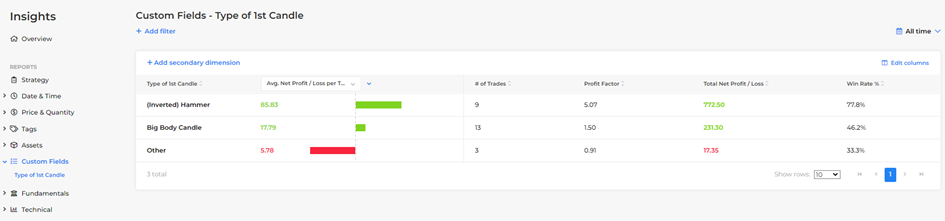
To find out whether the type of the first 1min candle matters for our performance, we go to the Custom Fields reports and click on Type of 1st candle. Right away, we can see a very clear picture: Trades taken after an (inverted) hammer candle are by far the best ones showcasing the highest average profit/loss per trade (85.83), profit factor (5.07), and win rate (77.8%). Positions after big body candles are less profitable, but still green overall. The negative average profit/loss per trade for other candles clearly states that we should avoid taking 1minORBs after just any kind of first minute candle in the future. This report therefore gives you an explicit recommendation on how to improve your performance: If you can, stick to (inverted) hammer candles!
Obviously, these results are based on a quite small example set of trades and aren't necessarily statistically significant. That’s why it is so important that you journal all your trades for every trading day: The larger the number of trades and the more honest you journal, the better Chartlog can give you recommendations on how to get better.
Next Chapter