The Ultimate guide to Journaling with Chartlog
The Journaling Process
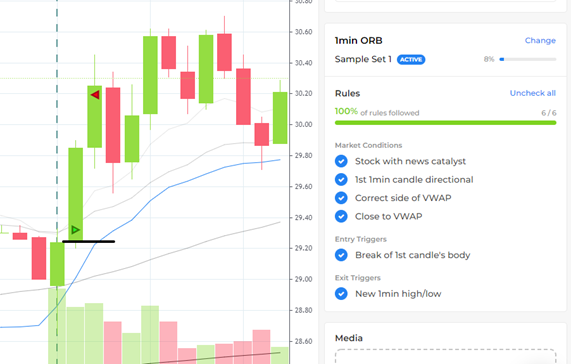
Now, let’s go through the journaling process together. After you’ve finished a trading day, your trades need to be recorded and reviewed. We go back to Journal and assign strategies to our trades. Since we only have the 1min ORB and the example set consists of 1min ORB trades exclusively, we can assign that strategy to every trade. Click on December 20th, the trade on $AMC. You'll see the trade in the middle of the screen. Green triangles stand for buy and red ones for sell executions. By default, the chart also shows a few moving averages in gray and the VWAP in blue. The vertical dashed line represents the market open at 9:30.
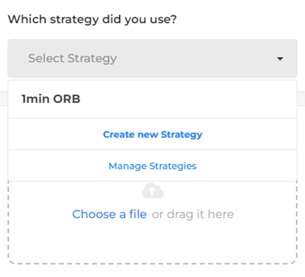
Choose the strategy on the right side in the details section. Next, go through the rules and check whether we followed them on this specific trade. We cannot immediately determine in hindsight whether the stock had a news catalyst on that day, so let’s just assume that is true for all our sample trades. We followed all other rules as well: The first candle was a green big body candle without a wick to the top side indicating strong buying pressure. We entered a long trade above VWAP (correct side), and our entry was close to VWAP as well (this is naturally a bit subjective). We took the trade when price broke the 1st candle’s body and we exited way before a new 1min high/low. Congratulations, we followed 100% of our rules on this specific trade!
We’ll assign the 1minORB strategy to all trades in the example set and note down which rules we did or didn’t follow. If you're following along, go ahead and do so now. That way, we’ll have the statistics we later need.
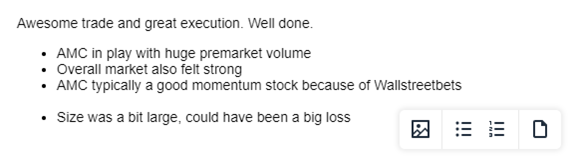
What else do we want to journal regarding the trade on $AMC? For example, let’s note down some thoughts below the chart in the description section.
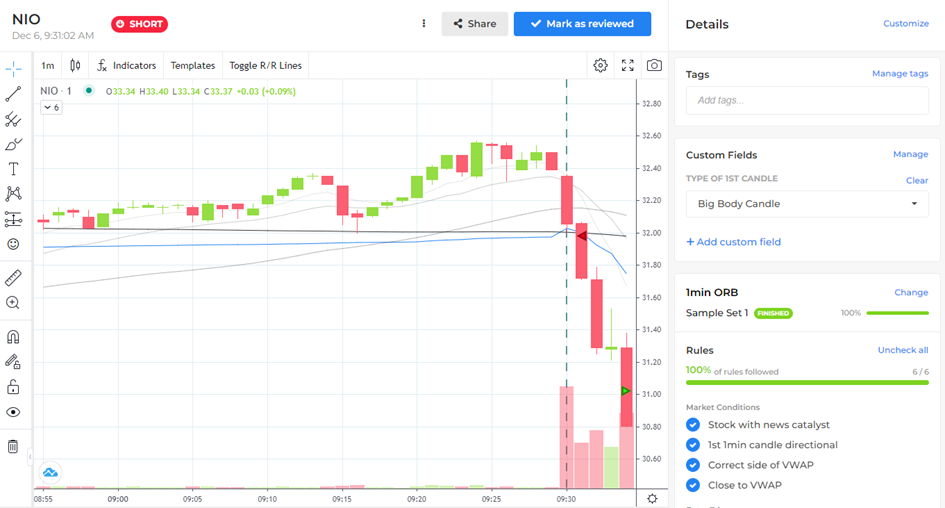
Now, we need to go through our trades again and chose which of the three options in our custom field fits the first 1min candle best. Let’s do it here for $NIO on December 6th. The first candle is a solid red big body candle, so that’s what we select in out custom field. Again, do this for all 25 trades to collect the needed data if you're following along.
There are a lot more options for what kind of information you can journal. You can add tags to your trades, upload media files, and set stop loss and target lines to calculate risk vs. reward ratios. We’ll stick to strategies and custom fields for this course, but when you’re journaling your own trades, feel free to look around and use Chartlog exactly the way you’d like to!
When you’re done reviewing a trade, make sure to click on Mark as reviewed, so you know which trades you already journaled. Trades that have yet to be reviewed and days that contain at least one unreviewed trade are marked with blue dots.
Time for a quick recap: We imported our sample trades, discovered Chartlog’s main tabs, created a strategy, set up a custom field, and reviewed our trades. What now, how do we get better?
Next Chapter